

Breathe Better. Live Smarter.®
Indoor air finally becomes actionable.
Know what changed. Know what to do. Terrestream Intelligence connects indoor readings, outdoor air, weather, pollen, smoke, room history, and source patterns into plain-English recommendations.
IAQ AQI
42
CO₂ ppm
612
PM2.5 µg/m³
7.4
VOC index
96
Actionable Intelligence
The point is not more data. The point is better decisions.
Your readings meet a dozen live outdoor data streams, and Terrestream turns them into nearly a hundred recognizable situations — each explained in careful language, with the one thing worth doing about it.
One system: every reading feeds a web of analysis that resolves into a situation and a suggestion. Illustrative — the engine runs more, continuously.
Your device supplies the readings. The cloud supplies the reasoning — fusing them with the world outside.
Indoor sensor
On your device
1,280 ppm CO₂
CO₂, PM2.5, PM10, VOC, NOₓ, temperature, humidity, pressure, and light.
Outdoor context
In the cloud
38 AQI
Weather, AQI, pollen, smoke, location, climate, and public data feeds.
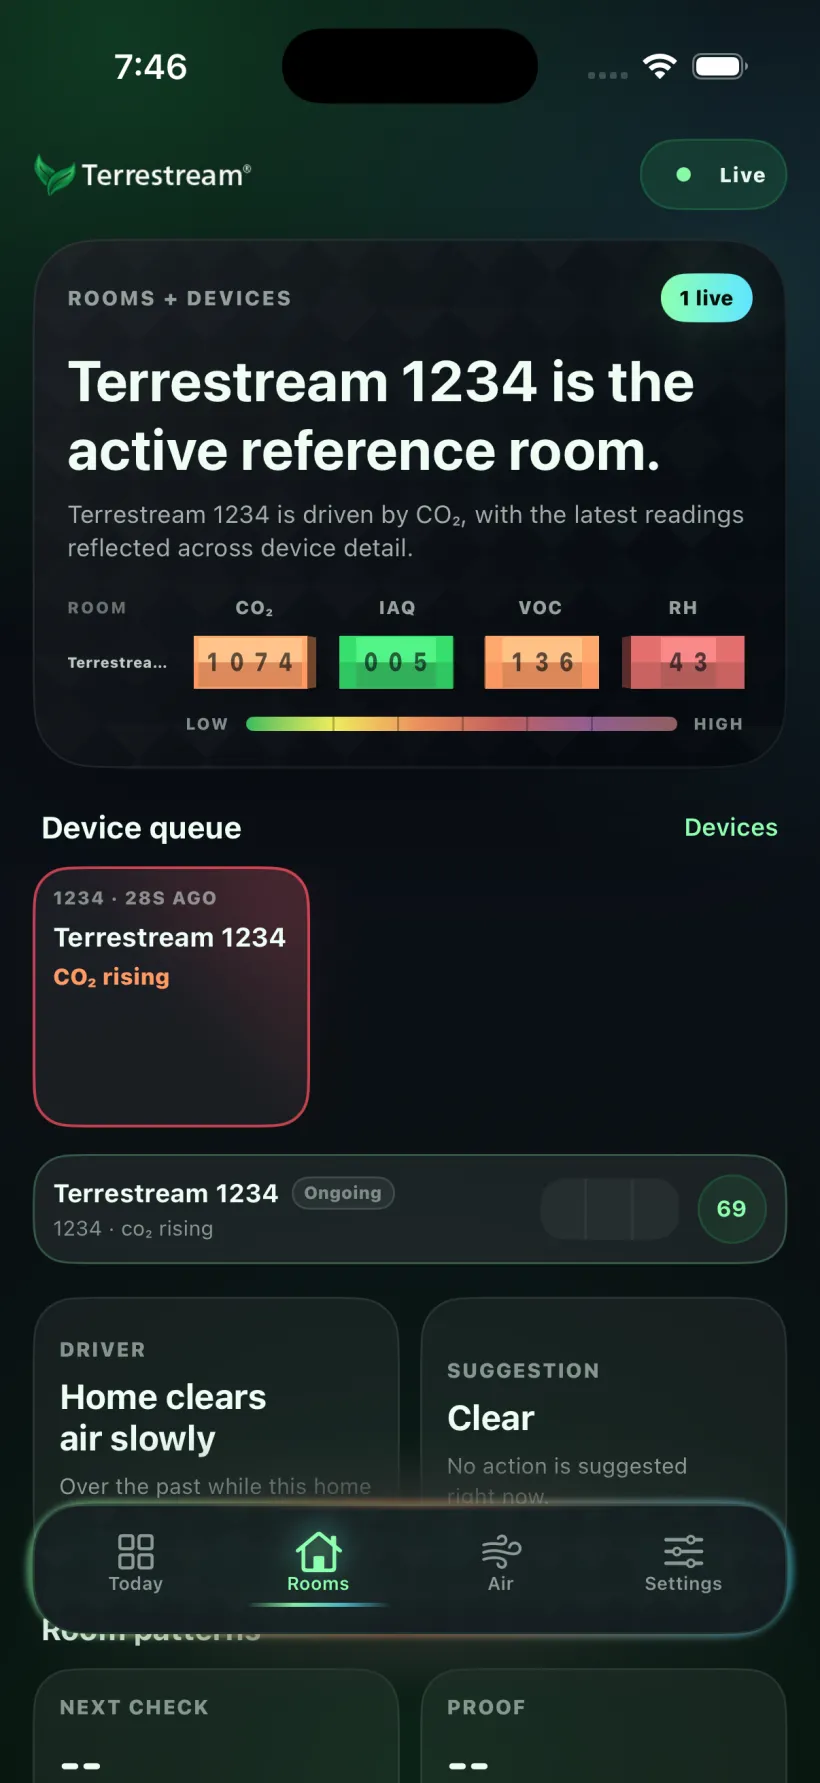
Room history
In the cloud
5 nights/wk
Baselines, recurring events, recovery curves, seasonal shifts, and comparisons.
AI synthesis
In the cloud
1 trial
Pattern detection, plain-language interpretation, and careful suggestions to consider.
Scenario synthesis
Office CO₂ buildup
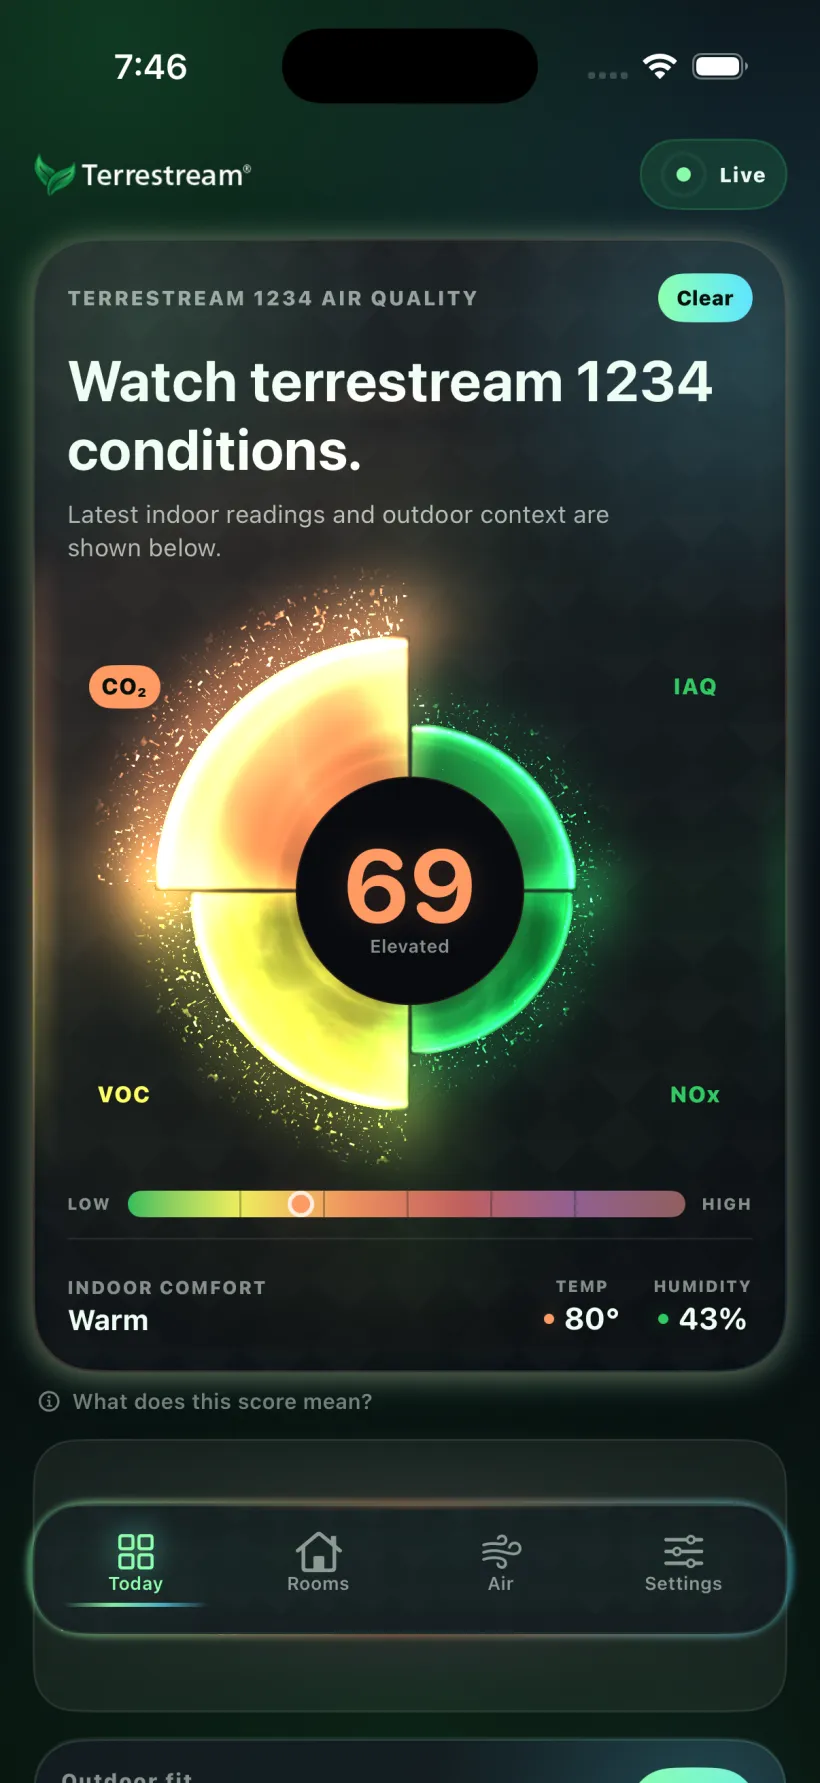
Today View
A calm command center for the room you are in.
The Today dashboard starts with the answer people need first: is the indoor environment okay right now, what is happening outside, and what might happen next?
- Attractive local map with current outdoor context.
- Easy overview status for the room and device.
- Twelve compact gauges for indoor signals plus weather and five-day outlook.
- Below the fold: readings, interpretations, notifications, trends, and useful environmental context.
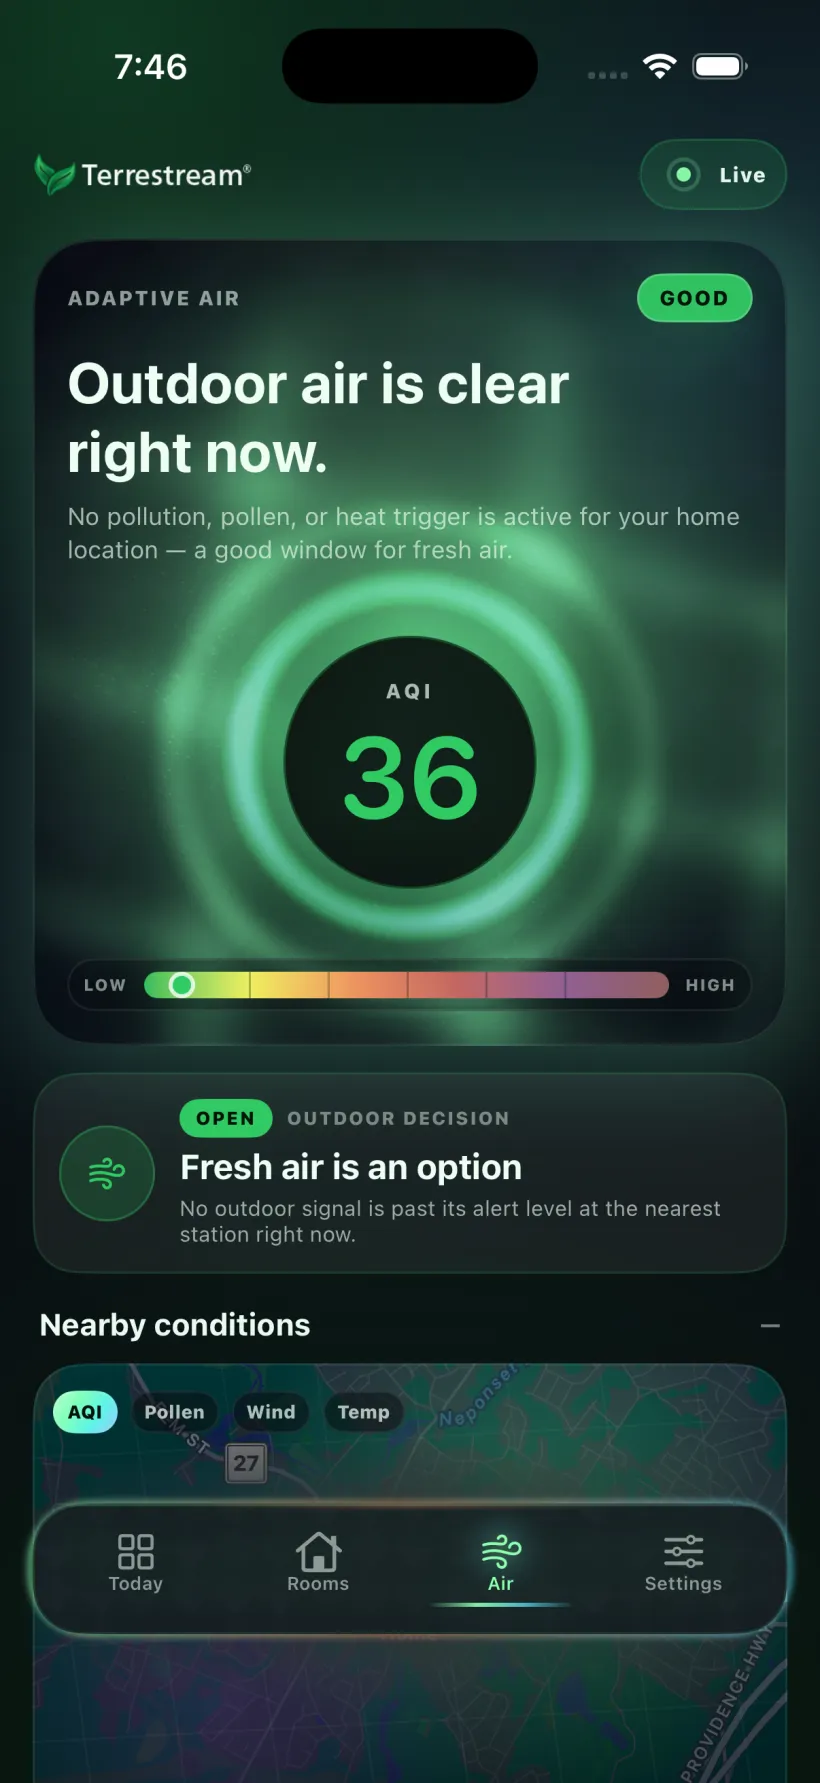
Outdoor context is fused from named, authoritative sources: Open-Meteo weather, Google Air Quality (US EPA AQI), Google Pollen, and NOAA HMS / NASA FIRMS smoke. See the data sources →
Outdoor context · live
Columbus, OH
Partly cloudy · outdoor AQI 81 · pollen Low
Outdoor AQI
81
Weather
72°F
Indoor IAQ
42
Wind
3 mph
Now+6h+12h+18h+24h
Indoor readings are weighed against live weather, outdoor air, pollen, and smoke so the dashboard can tell inside sources from outside ones.
IAQ AQI
42
CO₂ ppm
612
PM2.5 µg/m³
7.4
VOC index
96
NOₓ index
1
Temp °F
71
RH %
44
Outlook day
5
Dashboard View
Sophisticated analytics without the spreadsheet feeling.
The dashboard is alive: animated, interactive, colorful, and built around meaning. Apache ECharts powers dense analytical views, but the user sees interpretations instead of a data dump.
Live gauges
Right-now status, breakpoint colors, comfort bands, and current weather.
Time series
Cooking spikes, overnight CO₂ buildup, recovery after ventilation, and repeating schedules.
Maps and outlooks
Local weather, outdoor air, pollen, smoke, and environmental outlooks.
Advanced charts
Distributions, heatmaps, comparisons, correlations, and event timelines.
Interpretations
Readable summaries that explain what changed, likely causes, and what to watch next.
Notifications
Useful alerts when the data suggests a room deserves attention.
Signature view
How the air’s makeup shifts across the day
Not a line dashboard. A flowing composition of every metric at once, so the story of a day—a quiet morning, a cooking spike, an evening recovery—reads in a single glance.
Forty-plus visualization types, from gauges to distributions to correlations, all surfaced as interpretations instead of a data dump. The advantage is synthesis: your sensor plus high-quality external feeds, brought together so sources, weather, and repeating patterns are easy to read.
Data First
Your readings are not trapped in our interface.
Terrestream is built for people who want the dashboard and the underlying data. Export your history whenever you want, in useful shapes, with the range and metrics you choose.
- CSV
- JSON
- wide tables
- long tables
- date ranges
- room slices
- metric subsets
- comparison windows
Integrations
Local-first where it matters.
The device itself speaks to the systems many serious smart-home users already trust. No app or subscription is required for the core local integrations.
- Home Assistant
- MQTT
Home Assistant, MQTT, and the local HTTP API run from the device. Matter support is available through Home Assistant's Matter bridge for Apple Home, Google Home, and other Matter-compatible platforms.
Local
Home Assistant sees every signal.
Auto-discovered entities for CO₂, PM, VOC, NOₓ, comfort, pressure, and light without waiting on cloud automation.Open
MQTT and local HTTP for your stack.
Publish readings to your own broker, Node-RED flow, OpenHAB dashboard, database, or monitoring pipeline.Bridge
Matter through Home Assistant.
Expose the readings into Apple Home, Google Home, Alexa, and SmartThings through the Home Assistant Matter bridge.Mobile App
The same intelligence, designed for your pocket.
The mobile app brings much of the web dashboard experience to iOS and Android: status, trends, alerts, AI interpretation, machine-learning pattern detection, and practical suggestions when the air changes.
Web remains the flagship analytical surface; mobile is the faster daily companion.
-
 Your air, at a glance
-
 The outside world, factored in
-
 Every room — and what to do
Included vs Pro
The essential experience is included. Pro adds depth.
The $249 USD sensor includes the web dashboard, local integrations, recent history, export, external data context, and basic AI recommendations. Pro is for people who want longer memory, deeper pattern detection, and more advanced household intelligence.
Included
Dashboard fundamentals
Live dashboard, recent history, exports, weather/AQI/pollen/smoke context, basic AI insight cards, local API, MQTT, and Home Assistant.Pro
Deeper intelligence
Unlimited history, long-range comparisons, Family Circle, advanced pattern detection, recurring-event explanations, wellbeing/pet/sleep lenses, and advanced notifications.Breathe Better. Live Smarter.
Turn every reading into a next step.
One device. Six sensors. Twelve signals. Indoor readings connected to outdoor context and plain-English recommendations. Use Terrestream Intelligence to understand what changed, why it matters, and what to do next.
$249 USD one-time
Buy Terrestream See pricing- No subscription required
- 30-day returns
- 1-year limited warranty
- Fast shipping via FedEx
Six sensors. Twelve signals.
Built on genuine Sensirion, Bosch, and Texas Instruments sensors.
- CO₂
- IAQ
- VOC
- NOₓ
- PM1.0
- PM2.5
- PM4.0
- PM10
- Temperature
- Humidity
- Pressure
- Light
Included
- In the box: the sensor, USB-C cable, power adapter, and printed field guide
- Dashboard and mobile app included
- Privacy-first air data
Works with
- Home Assistant
- MQTT