
What is IAQ?
A single composite score that summarizes indoor air, calibrated to the same 0–500 scale as the U.S. EPA outdoor AQI.

Breathe Better. Live Smarter.®
Know what changed. Know what to do. Definitions, thresholds, sources, and recommended responses for every Terrestream reading.
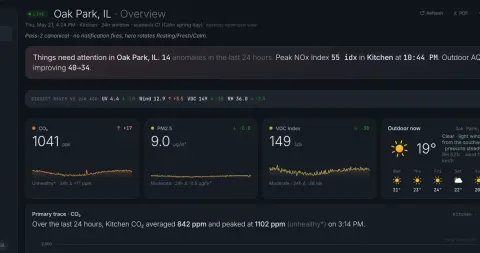
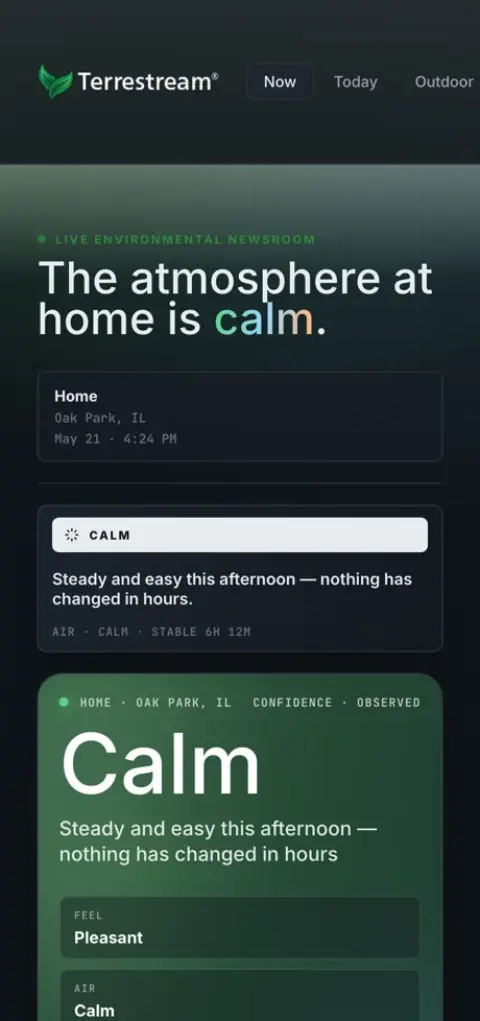
Device readings, weather, pollen, smoke, and source patterns are connected into practical responses instead of isolated numbers.
Start with what you noticed
Start with your question
Compare monitors
These articles are dated and sourced so Terrestream can be compared against real devices without turning the product page into a wall of competitor copy.
A single composite score that summarizes indoor air, calibrated to the same 0–500 scale as the U.S. EPA outdoor AQI.
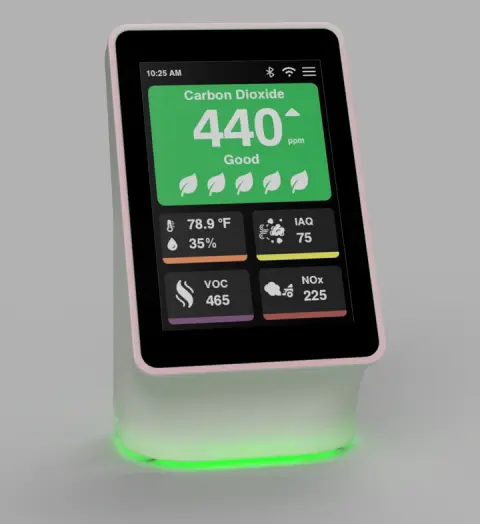
Every exhale adds CO₂ to the room. Past about 1,000 ppm, focus slips. Past 1,500, headaches.
Particles smaller than 2.5 micrometers slip past your nose, lodge deep in the lungs, and cross into the bloodstream. They are the single most-studied air pollutant.
Larger particles that mostly get filtered in the upper airway, but they still matter for allergies, asthma, and visibility.
Volatile organic compounds are the carbon-based gases evaporating off everything: cooking, candles, paint, new furniture. Some are merely annoying. Some are not.
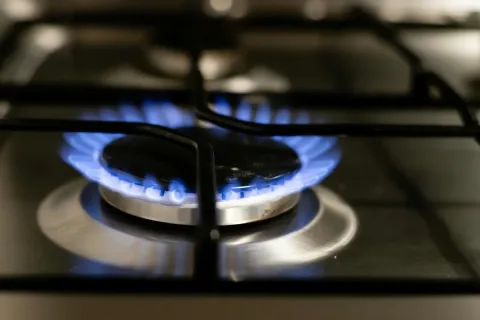
Nitrogen oxides come from combustion. Indoors, the main source is a gas stove. The health link with childhood asthma is robust.
Below 30%, your throat dries out and viruses last longer. Above 60%, mold and dust mites thrive.
ASHRAE defines a comfort zone. The bedroom is its own special case: cooler is better.
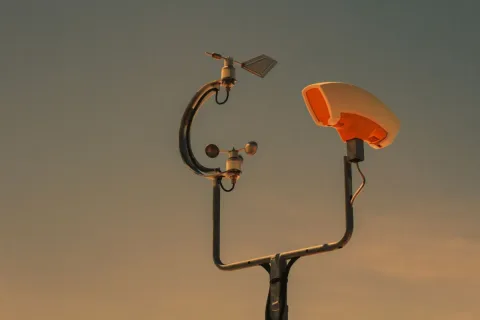
Pressure rarely changes how the air feels, but it changes how the body feels. It is also the most reliable indoor weather forecast you have.
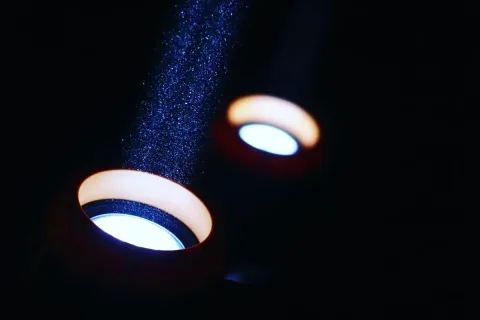
Light is information your body uses to set its clock. Most indoor environments give it the wrong information.
Formaldehyde (HCHO) is the most asked-about specific VOC. The Terrestream SEN66 does not measure, report, or detect it - do not use the device to check for formaldehyde. If you suspect it, get a dedicated test or professional advice.
Benzene (C₆H₆) is IARC Group 1, present in vape aerosol, traffic, attached garages, and wildfire smoke. The Terrestream SEN66 does not measure, report, or detect it - do not use the device to check for benzene. Only speciated lab testing can identify it; if you suspect benzene, seek professional testing or advice.
Ground-level ozone is the most consequential summertime air pollutant in much of North America. The sensor cannot detect it directly; the dashboard pulls it from Open-Meteo.
Both numbers use the same 0–500 color band, but the math is different and so is the answer to "is it bad?"
When outdoor ozone or pollen is high, "open a window" stops being good advice.
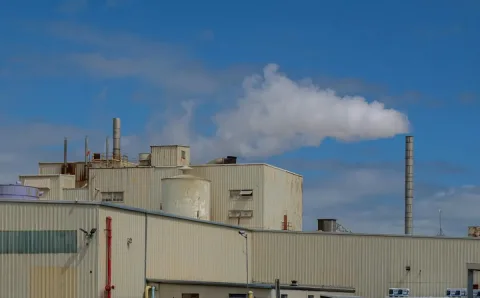
SO₂ comes from burning sulfur-bearing fuels: coal, heavy oil, diesel ships, volcanic activity, and wildfires. The device does not measure it; the dashboard pulls it from Open-Meteo.
Three reasons your number rarely matches the official outdoor AQI: hyperlocal variation, time resolution, and calibration class.
Relative humidity is relative to temperature. Dew point is absolute. If you want to know whether the air is "muggy," dew point is the number.
The thermometer reading is just the air. Heat index and wind chill account for humidity and wind: closer to what your body experiences.
The UV index condenses solar ultraviolet intensity into a 0–11+ scale. Above 6, take precautions. Above 8, every minute counts.
Outdoor wind drives air through small cracks and gaps in your building. Higher wind = more outdoor air entering, whether you want it or not.
Alder, birch, grass, mugwort, olive, ragweed. Open-Meteo reports each; the seasons are very different.
Rain removes particles from air. Snow does too, more slowly. The hours after a steady rain are some of the cleanest air you'll ever breathe outside.
The same reading means different things in cold-dry, hot-humid, and temperate climates. The interpretation adjusts.
Winter, spring, summer, fall. The dominant indoor-air pressure changes with the calendar.
Canada uses a 0–10+ health-risk index instead of the US 0–500 AQI. Different math, different recommendations, same goal.
What satellites see when they look at our atmosphere. Aerosol Optical Depth quantifies how much sunlight gets scattered or absorbed by particles, and it lines up with ground-level PM in useful ways.
Saharan dust to the Caribbean and Texas, Asian dust to the Pacific Northwest. Distinct from wildfire smoke chemically, sometimes visually similar.
How far you can see is a direct proxy for how much fine particulate is in the air. The relationship is well-quantified and useful.
Cloudy days produce less outdoor ozone. Sunny days produce more. The dashboard uses cloud cover to predict tomorrow's ozone today.
Direct radiation, diffuse radiation, shortwave total. The numbers behind outdoor ozone, indoor lux, and the circadian signal all come from the same place.
Fresh snow scrubs particulates from outdoor air. Persistent snow traps cold air at the surface, sometimes for days, with all that implies for inversions.
A short list of headline genera covers the broad strokes, but tree pollens vary by region. Oak in the South, cedar in Texas, maple in the Northeast, birch in the North.
Outdoor mold spore counts are tracked alongside pollen by allergy services. Different biology, often confused, sometimes the actual culprit when pollen seems low.
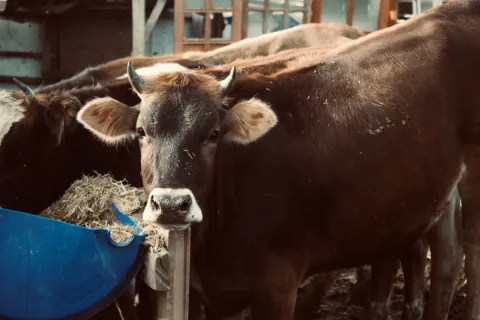
NH₃ from livestock and fertilizer is a major PM2.5 precursor. The outdoor feed does not carry ammonia itself; what the dashboard shows is the resulting outdoor PM2.5 from the Google Air Quality API.
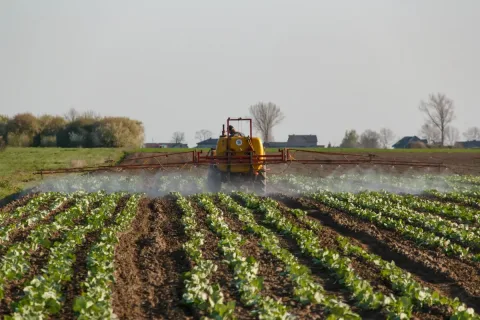
Pesticide drift is the rural-IAQ analog of wildfire smoke: outdoor-driven, episode-based, and worst during spraying seasons. The playbook is forecast, close, filter.
Outdoor PM2.5 and NOx sit higher near highways, near ports, near industrial sites, and downwind of all three; those locations correlate with race and income in the United States and Canada in ways that are not accidents.
A fixed indoor sensor cannot follow you into a car cabin, a bus, or a bike lane next to a highway. The exposure that happens on the way to work is real, and it belongs to a different category of instrument.
A complex aerosol dominated by PM₂.₅, with VOCs, NOx, and dozens of trace species. Indoors, the right response is to seal up and filter, not ventilate.
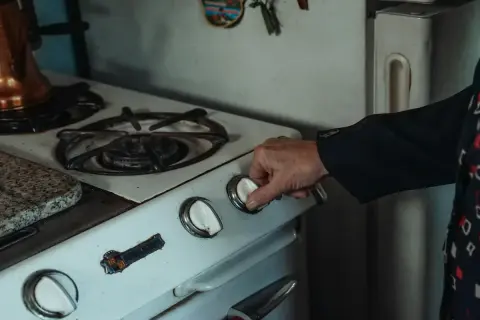
A pan on a gas burner produces a remarkably consistent multi-pollutant signature: NOx, ultrafine PM, VOCs, and humidity, all rising and falling together.
A single candle can push a small room past 100 µg/m³ PM₂.₅ in under ten minutes. Incense is worse.
Pine, citrus, ammonia, bleach. Most cleaning products produce sharp VOC spikes; some combinations are acutely toxic.
Particleboard, foam, finishes, and many paints off-gas formaldehyde and other VOCs for weeks to months. A new sofa changes the room's baseline.
Two adults in a closed bedroom can push CO₂ past 2,000 ppm by 4 AM. The math is unforgiving.
A running engine ten feet from your living space. Cold-start emissions are the worst. Door seals matter more than you think.
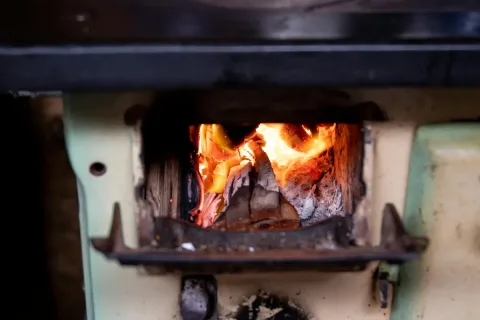
Solid-fuel combustion produces the largest, longest-lasting PM event most homes ever see indoors. Even a well-tended fire shifts the baseline for hours.
Combustion and aerosolization indoors. Tobacco smoke, cannabis smoke, and vape aerosol all show on the sensor; the health profiles differ significantly.
A hot shower is a daily humidity event with a side of cleaning-product VOCs. Recognizable, mostly harmless, occasionally a mold-risk signal.
The first month is when off-gassing peaks, cleaning is heaviest, and the dashboard learns your normal. Expect noise; expect resolution.
Turkey day, parties, holiday candles, family visits. Combined source events look different from any single source.
Gas, induction, electric, grilling, frying, roasting. Each cooking method has a distinct multi-parameter signature.
Common in the desert Southwest, evaporative coolers add 20-40 grains of moisture to the air for every degree of cooling. Different dynamics than AC, and a different humidity playbook.
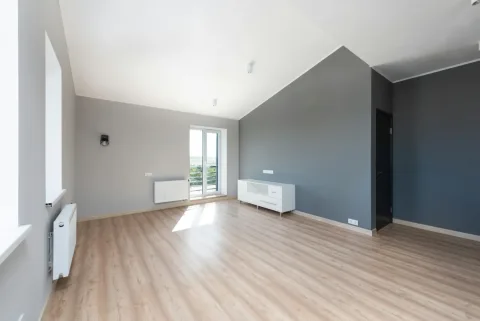
The first thirty days after renovation are the highest-emission window the building will ever see. The right protocol cuts months off the off-gas tail.
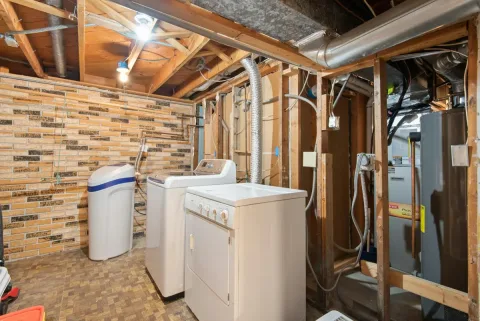
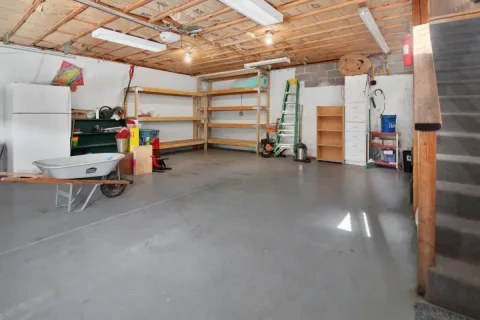
Basements run cooler, more humid, and lower-ventilated than the floors above. The HVAC lives down there, the water heater lives down there, and so do the paint cans, the radon, and most of the mold problems.
In a multi-unit building, your air is your neighbors' air. Cooking, smoking, cleaning chemicals, even fragrances migrate through shared HVAC, plumbing chases, and balcony paths. Here is how that happens and what can actually be done from inside one unit.
A tight 2020 build and a leaky 1925 farmhouse fail in opposite directions. The dashboard signatures are different, the priorities are different, and "better" depends on what you are trying to solve.
Your clothes shed plastic. So does your carpet, your bedding, and your packaging. The dashboard's PM channels see the bigger fragments as a subset of total particles; the science on health impact is still arriving.
PFAS exposure indoors is dominated by dust ingestion and dermal contact, not by inhalation. The SEN66 cannot detect them; reducing PFAS load is a housekeeping and procurement problem, not a sensor problem.
You spend a third of your life within a foot of a polyurethane foam slab. The "new mattress smell" is a measurable VOC emission curve, and it lasts longer than the marketing suggests.
Combustion is combustion: PM2.5, CO, PAHs, benzene. Cannabis adds THC and CBD aerosol and a different terpene signature. The dashboard sees it as a tobacco-shaped event with a longer VOC tail.
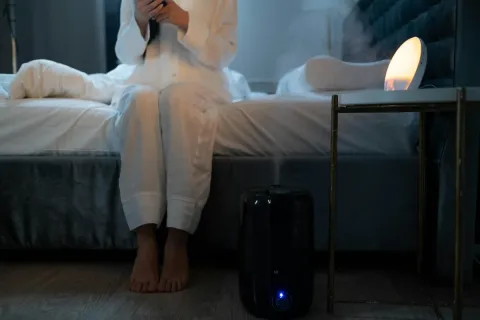
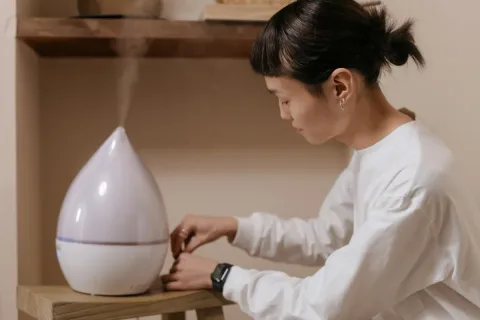
A neglected ultrasonic humidifier aerosolizes whatever is in its reservoir, including bacteria. This is the one IAQ device where maintenance is a life-safety issue, not a comfort one.
The blanket "carpet is always bad for IAQ" rule does not survive contact with the data. Quality, age, maintenance, and what is under the floor matter more than the category.
Hobby 3D printing emits ultrafine particles and VOCs that scale with filament chemistry and bed temperature. The dashboard sees it; here is what is happening and how to print without exposure.
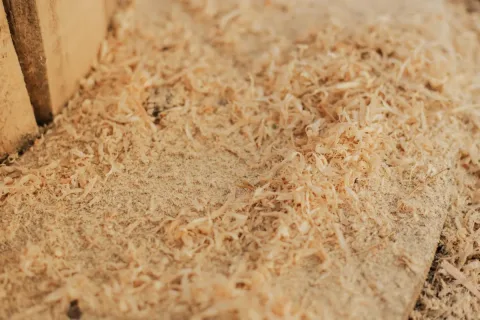
Sawdust from oak and walnut is an IARC Group 1 carcinogen for occupational woodworkers. The hobby shop in your garage deserves the same controls; the dashboard will tell you whether they are working.
Below 100 nanometers, particles get small enough to cross from lungs into bloodstream. The SEN66 sees PM₁ but stops there.
Terrestream does not detect mold or count spores. It reports temperature, pressure, and relative humidity - conditions that are sometimes associated with mold. Mold can also grow in conditions and places the sensor never sees.
House dust mites need humidity to reproduce and warmth to thrive. The sensor reads both. Allergen is in the air whenever the bed gets disturbed.
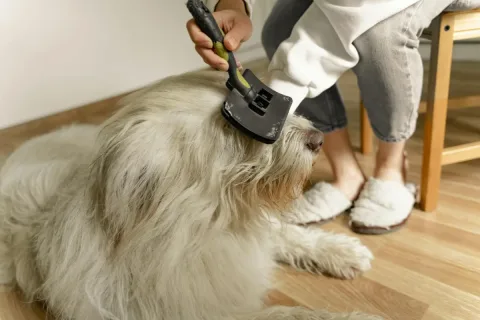
Cat allergen is sticky and stays airborne for hours. Dog allergen settles faster. Both show up in PM₁₀ when pets move through a room.
Kids breathe 50% more air per kg than adults, spend more time indoors, and have lungs that are still developing.
Asthma is the most common chronic disease in children. Most of its triggers are things the sensor sees.
PM₂.₅ kills more people through hearts than through lungs. The mechanism is systemic inflammation, oxidative stress, and direct arterial effects.
Cardiovascular sensitivity, frailty, medication interactions, and time-indoors all shift with age. The thresholds shift too.
Chronic obstructive pulmonary disease affects 16 million US adults. PM2.5 sensitivity is higher than asthma, exacerbations are more dangerous, and indoor recovery matters more.
VOC bursts, pressure drops, low CO₂-induced drowsiness preceding a migraine: the dashboard can document triggers a person knows but cannot prove.
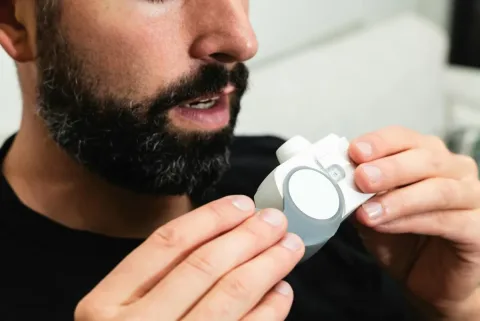
OSA outcomes interact with bedroom-overnight conditions. The right humidity, low dust-mite allergen, and adequate ventilation can improve CPAP comfort and reduce AHI.
Recent research links chronic PM2.5, VOCs, and indoor CO₂ to depression, anxiety, and cognitive performance. The data is suggestive, not yet prescriptive.
Pets share your indoor air. Birds are uniquely sensitive (the "canary in a coal mine" is literal); dogs and cats have their own profiles.
A newborn breathes faster, has smaller airways, and spends almost every hour of every day in the same indoor environment. The standard adult guidelines were not written with that physiology in mind.
Counter-height, away from vents and windows, in the room you actually use. The placement choice changes what you can interpret.
The single most consequential daily decision the dashboard helps you make. Six outdoor signals, three indoor signals, one answer.
CADR, room volume, air changes per hour. The math behind "the room should clear in about 20 minutes."
What "elevated," "spike," "trend," "baseline," and "anomaly" mean. The vocabulary the AI uses.
You can't replace the HVAC, but you can do most of what matters. Eight interventions that need no landlord permission.
Two sensors tell more than one twice. The difference between rooms is often where the real story is.
Why the dashboard shows sunrise, sunset, and moon phase alongside the air-quality data. Time of day is a meaningful signal.
A sealed empty home behaves predictably while you are gone. The first 24 hours back tells you what changed.
The dashboard's outdoor card layers several data streams: the Open-Meteo weather forecast, Google Air Quality for outdoor pollutants and the US EPA AQI, weather observations, and Google Pollen for pollen forecasts. Here is the pipeline.
The SEN66's individual channels each drift differently. CO₂ self-calibrates against outdoor air, PM loses a few percent per year, VOC and NOₓ are relative baselines by design. Here is what changes and what does not.
Sensors fail in a small set of recognizable ways. The dashboard flags the failures and the AI refuses to act on them. Here is how to tell a real spike from a glitch.
Three sensor packages, six sensing elements, twelve signals. Here is what is inside the device, what each part measures, and the physical reasons it can and cannot do what it does.
Vacation rentals are someone else's indoor environment with someone else's cleaning routine, ventilation choices, and smoking history. A portable sensor turns that opacity into one hour of data.
A short first-run path: power the sensor, pair it, connect Wi-Fi, claim it to your account, then place it where the room air can circulate.
Use the 6-digit passkey on the device screen to create an encrypted Bluetooth pairing, then finish the claim flow in the app.
Terrestream uses 2.4 GHz Wi-Fi. You can configure it from the app or use the temporary setup network when no Wi-Fi is saved.
A brief Tuesday fan sound is normally the SEN66 sensor self-clean cycle.
Use Quiet Hours and device/app settings to reduce display, light, and sound behavior on a schedule.
Factory reset clears saved device configuration, claim, and account-linking information so the sensor can be paired again.
Factory reset the sensor before another person receives it.
Use the privacy portal and published Privacy Policy for binding answers about personal data, sharing, deletion, and export.
A fair, sourced buyer guide to Terrestream, AirGradient ONE, Ruuvi Air, Awair Element, Airthings View Plus, Aranet4 HOME, Kaiterra Sensedge Mini, and IQAir AirVisual Pro.
Awair Element is a compact five-factor monitor; Terrestream adds broader particulate sizing, NOx, pressure, light, and deeper interpretation.
Airthings View Plus is compelling when radon is central; Terrestream emphasizes multi-signal indoor behavior and local-friendly workflows.
Aranet4 HOME is a focused portable CO₂ monitor; Terrestream is a broader room air-quality system.
IQAir AirVisual Pro emphasizes PM2.5, CO₂, AQI, and a large color display; Terrestream adds more indoor channels and source interpretation.
AirGradient ONE is an open-home indoor monitor with strong local-home appeal; Terrestream emphasizes polished room interpretation, commercial evidence, and buyer-ready guidance.
Ruuvi Air is a credible open-friendly SEN66 monitor; Terrestream emphasizes Wi-Fi-direct operation, a touchscreen display, outdoor-data fusion, and US buyer readiness.
PurpleAir is strongest as a particle and outdoor-map ecosystem; Terrestream is built for indoor room decisions across particles, gases, comfort, context, and recommendations.
Apollo AIR-1 is a compact ESPHome/Home Assistant monitor with strong local-control appeal; Terrestream emphasizes a finished room device, broader buyer guidance, and included cloud intelligence.
Many sensors across a building or campus, one dashboard, notifications when something looks unusual. A B2B contract unlocks the multi-site management plane and rule-based notifications keyed to your organization's hours, occupancy, and standards.
Eight people in a 6×8 m room with the door closed will hit 2,000 ppm in under an hour. The cognitive cost is real and measurable.
Run the HVAC harder when people are in the room, less when they aren't. CO₂ sensors are how it knows.
Decisions get worse, errors rise, and absences increase as air quality drops. The literature quantifies it; the dashboard surfaces it.
A cluster of complaints, no single identifiable cause. The diagnosis has fallen out of fashion; the underlying problems haven't.
Test scores correlate with ventilation rates. Attendance correlates with ventilation rates. The literature is unusually consistent.
The U.S. EPA's structured framework for school IAQ management. Free, well-documented, widely adopted.
Close, mask, or shelter-in-place? AQI thresholds, building envelope, and student-population considerations.
A typical office starts at outdoor CO₂ baseline and ends the day at 1,200 ppm in the meeting rooms. Plus VOCs from cleaning and new furniture, plus whatever the outdoor air brings in.
Classrooms exceed CO₂ targets routinely, locker rooms add cleaning-product VOCs, older buildings have mold, and the school bus idles ten feet from the intake. A separate environment from home, with its own problems.
Closed door, one kid, two or three hours of after-school homework in a small bedroom. The cognitive-science literature predicts exactly the focus collapse parents see, and the dashboard usually shows the cause.
Sensor selection can be relevant to standards-aligned workflows, but device parts alone do not confer certification, accreditation, or code compliance.
Schools need room-level evidence: CO₂ for ventilation, PM recovery for filtration, humidity for comfort and building risk, and source patterns that facilities teams can act on.
Office IAQ monitoring turns meeting-room CO₂, filtration recovery, cleaning VOC events, and HVAC patterns into decisions facilities teams can defend.
Light-industrial spaces need pattern visibility around dust, combustion, solvents, ventilation, and maintenance. IAQ monitors support triage; they do not replace occupational hygiene instruments.
The dashboard interprets your air. It does not diagnose you, replace your doctor, or detect things the sensor cannot measure.
The small set of words the dashboard uses with specific, defined meanings. Precision in the vocabulary lets the AI and the reader stay aligned.
Each pollutant decays with its own characteristic shape. The shape is how the AI tells one event from another.
Minutes to seasons. Knowing which time scale a parameter lives on is half of interpreting it correctly.
Air-quality parameters do not change in isolation. Humidity pushes the VOC index. Ozone reacts with limonene to make formaldehyde. Knowing the interactions is how the AI avoids false alarms.
A bad afternoon and a bad decade are different problems. The literature is clear about which matters more for what.
Is your air normal? Population-level studies and the dashboard's own data let you compare to typical homes.
Three words public-health professionals use carefully. Loose usage in air-quality conversations causes most of the misinterpretation.
When the data does not match any known pattern, the dashboard logs the event and asks for help interpreting it. That is by design.
Apartments, townhomes, detached single-family, and commercial buildings each have characteristic air-quality patterns. The AI uses the building type as a structural prior.
Every reading on the dashboard has a source: a sensor on the device, a computation from sensor inputs, or an outdoor API. Knowing which is which is the first step in interpreting any of them.
PM10, PM2.5, PM1.0, ultrafines. Same physics, different particle-size buckets. The size determines where particles lodge in the body and what produced them.
EPA AQI, WHO 2021 guidelines, Canadian AQHI, European CAQI. Four different ways to summarize the same air.
HEPA, MERV, Corsi-Rosenthal. Three filtration paths to the same goal. Cost, performance, deployability differ in different directions.
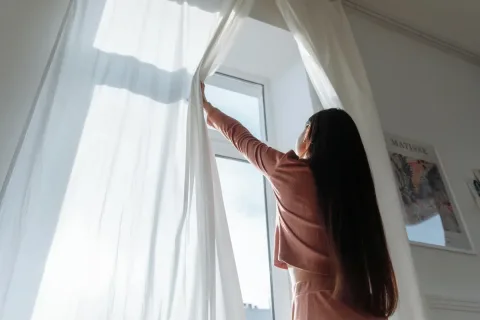
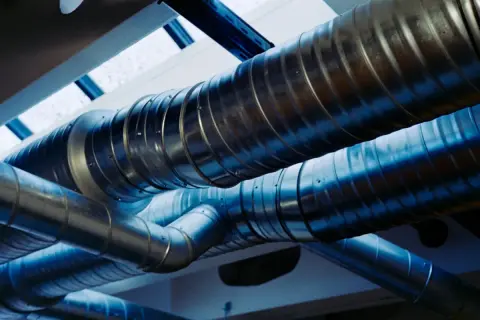
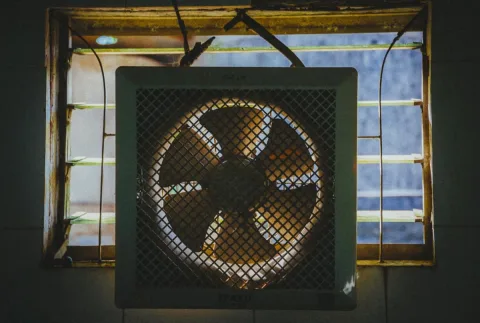
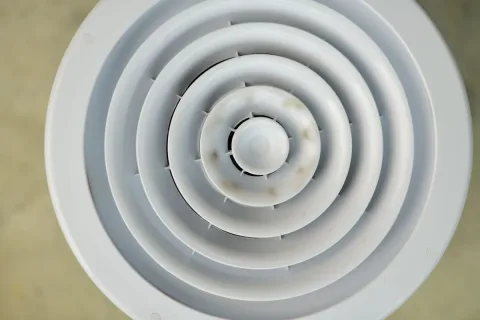
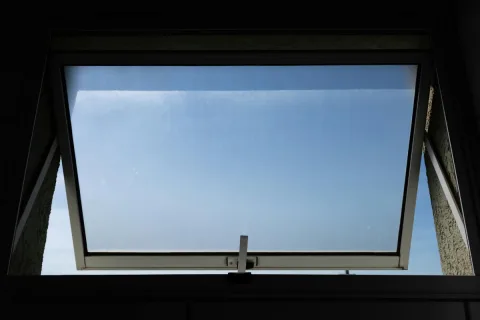
Open windows, range hood, HRV/ERV, demand-controlled ventilation. Different ways to bring fresh air in and stale air out.
Anything that burns indoors produces a multi-pollutant signature: NOx, fine particulates, VOCs, ultrafines, and (sometimes) CO. The dashboard has a shared interpretation framework for all of them.
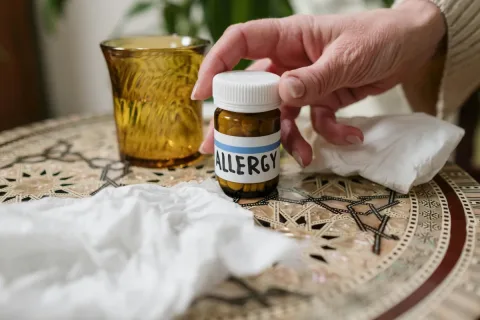
Mold, dust mites, pet dander, pollen, mold spores. Most household allergen exposure is one of these five. The dashboard groups them as a family.
Sometimes the air feels wrong even when all the numbers look normal. The dashboard integrates several parameters into a subjective-experience model that explains why.
Most households run on a 5-and-2 schedule. The air does too, in ways the AI uses to set its baseline.
Every cubic foot of outside air you bring in is air you have to heat or cool. In some climates "just open windows" is correct; in others it is the most expensive intervention you can pick.
A near-linear CO₂ climb that does not decay is the signature of a room rebreathing its own air. The math is straightforward and the pattern is unmistakable on the dashboard.
Two landmark chamber studies (Satish 2012, Allen 2016) show executive function dropping monotonically as CO₂ rises from 550 to 1,400 ppm. The shape, the domains, and the mechanism candidates.
For most outdoor-driven pollutants, indoor concentration divided by outdoor concentration is the single most diagnostic number in the dashboard. It tells you whether your house is sealed, filtered, or leaking.
Open-Meteo gives you hourly outdoor forecasts up to 7 days out. The dashboard uses them to suggest action before a problem arrives, not after. Here is how the forecast horizon maps to confidence.
Each of the three inputs is a signal. Combined, they let the AI predict whether an indoor event is about to happen, and recommend action before it does.
The dashboard speaks in three voices: confident, cautious, and openly uncertain. Knowing which voice you are hearing is half the value.
The dashboard will tell you about your air. It will not diagnose, prescribe, or speculate about your health. The line between those two is bright and intentional.
Accuracy, precision, and drift are three different things, and consumer-grade sensors trade absolute accuracy for cost and form factor. Here is what the numbers on the dashboard actually mean.
A short spike and a long low-level exposure can produce the same dose with completely different health implications. The dashboard tracks both because they answer different questions.
CO₂ does not measure pathogens. But CO₂ and exhaled pathogen droplets share a source (occupants) and a sink (ventilation), so the indoor-to-outdoor CO₂ ratio tracks the fraction of air in the room that other people have already breathed. This is why the Aranet model was widely adopted for ventilation monitoring during the pandemic.
"Sick building syndrome" gets used to mean three different things, and the difference matters because each leads to a different diagnostic path. Here is the disambiguation, with the room-by-room signatures the dashboard can and cannot help find.
Warm air rises, cool air falls, and exhaust fans push the balance around. The result is that pollutants move through a building in predictable directions, the basement supplies the bedrooms more than you think, and a bath fan can backdraft a water heater. The dashboard makes the patterns visible.
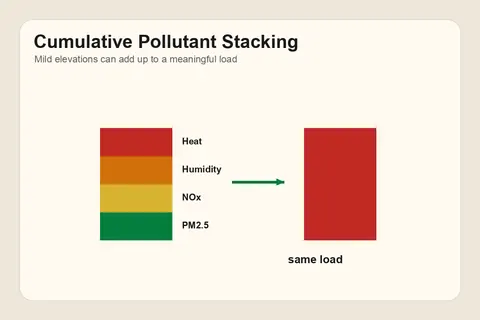
The body does not see pollutants one channel at a time. Mild PM2.5, mild NOx, mild humidity, and warm temperature can stack into a load that none of them would carry alone, and the dashboard reads them that way.
The Terrestream stack combines direct measurements, index outputs, context sensors, and interpretation. Those are different evidence classes, and the distinction matters.
Optical PM sensors estimate mass from scattered light. They are powerful for building telemetry, but aerosol chemistry and particle shape still matter.
VOC Index is a relative signal from a MOX gas sensor. TVOC is a concentration-style lab concept. They should not be collapsed into the same claim.
NOx Index is a combustion-pattern signal. It is not a regulatory NO₂ concentration measurement.
CO₂ is the clearest occupancy and ventilation signal in most rooms, but placement, calibration assumptions, and recovery time still shape the interpretation.
Pressure is not an IAQ compliance channel. It is building-physics context that helps explain when outdoor air, weather, and HVAC operation are shaping indoor readings.
Lux helps interpret placement, daylight, display behavior, and occupancy patterns. It is not proof of circadian lighting performance or WELL lighting compliance.
Good monitoring is not just a sensor spec. It is calibration evidence, drift expectations, placement discipline, and confidence-aware interpretation.
EPA NAAQS is regulatory. WHO 2021 is aspirational. The dashboard shows you both.
ASHRAE 62.1 covers commercial; 62.2 covers homes. Both give you a number in CFM per person.
Canada publishes its own per-pollutant residential indoor-air guidelines. They are tighter than EPA on NO₂ and similar on PM₂.₅.
For commercial buildings, three certifications dominate the indoor-air conversation. Each weights different things.
A HEPA filter is the most effective single intervention for indoor particulates. Sizing it correctly is the part most people get wrong.
A $50 box fan, four MERV-13 furnace filters, and twenty minutes of construction. CADR comparable to a $400 commercial unit.
MERV 8 catches dust. MERV 13 catches viruses. MERV 16 catches almost everything HEPA does. Most homes ship with MERV 6.
A properly vented hood at high speed captures 70-95% of cooktop emissions. A recirculating hood captures almost nothing.
CO₂ is read by pulsing infrared light the gas absorbs and listening for the pressure wave. VOCs are read by watching a hot ceramic surface change conductance. Different physics, different limits.
Every sensor has things it sees that it shouldn't. Knowing the cross-sensitivities is how the dashboard tells you the right story.
A single metric tells you a number. Several metrics moving together tell you what happened.
A decision tree. Start with the source, end with the intervention. Each branch has a different right answer.
Sustained CO₂ above 1,000 ppm means ventilation is not keeping up with occupancy. Four diagnostic paths.
Elevated VOC index for days or weeks. Five possible explanations, each with a different response.
Indoor humidity outside the 30-50% comfort and mold-safety range. Four diagnostic paths.
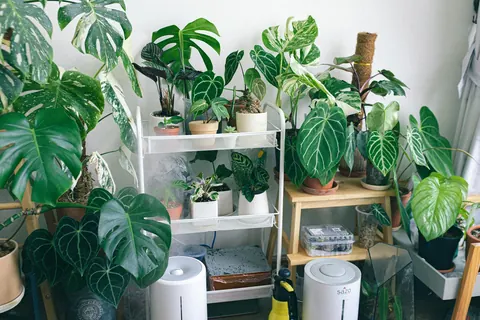
A famous study tested potted plants in sealed chambers. Real-world rooms have orders of magnitude more air; the practical contribution is negligible. Have plants because you like them.
CO₂ is what people exhale. The only durable answer is moving more outside air in. Here is the cost-ordered ladder, from free to capital project.
Indoor NOₓ comes from combustion. The intervention hierarchy starts with eliminating sources and ends with capture-and-exhaust for what remains.
Two levers: stop making fine particles, and remove them when they appear. CADR-sized HEPA in occupied rooms plus a MERV-13 HVAC filter does most of the work.
PM10 settles faster than PM2.5 and is more about deposited dust than airborne particles. Walk-off mats, damp methods, and HEPA-vacuuming carry most of the load.
VOCs are easiest to manage by not introducing them. When you cannot avoid them, ventilation and bake-out are the durable tools.
The 30-50% RH band is the IAQ sweet spot. Above 60% RH for sustained periods, mold and dust mites become a problem.
Cold outdoor air holds little water; once heated indoors, RH drops below 30%. Static, dry skin, respiratory symptoms, and infection-transmission risk all rise.
Indoor ozone comes mostly from outdoor infiltration on bad-air days. The playbook is window timing, building-envelope sealing, and avoidance of ozone-emitting devices.
SO₂ is almost entirely outdoor-driven from coal combustion, port shipping, oil refining, and volcanic emissions. The playbook overlaps PM2.5 plus SO₂ specifics.
A leaky house exchanges air the wrong way: cold drafts, dust infiltration, radon, outdoor ozone. Seal first, then add controlled ventilation. The order matters.
Task-specific exhaust handles the worst pollutant sources at their origin. Sized correctly and ducted to outdoors, it does more than whole-house ventilation can.
Green Seal, GREENGUARD Gold, CARB Phase 2, FloorScore: which certifications actually mean low emission, which numbers matter, and where the labels do not help at all.
You do not need an HRV and three air purifiers to improve indoor air. The first $0 to $200 of effort delivers most of the gains. Here is the ladder, ordered by impact per dollar.
Most IAQ problems are DIY. A handful are not. Here are the triggers that say "stop, hire a credentialed professional", and how to choose one.
You cannot get to zero dander or zero ammonia in a pet-containing home. Reducing exposure 50-80% is realistic, and the levers are mostly weekly habits rather than equipment purchases.
A wildfire-smoke event runs better when the supplies are already on the shelf and the envelope is already tight. Here is the May-through-September checklist, sized to a typical western-US household.
Replacing the gas stove with induction, the gas water heater with a heat pump, and the gas furnace with a heat pump removes the three largest indoor combustion sources at once. The IAQ delta is visible on the dashboard; the financial picture has shifted with new federal credits.
During hard exercise you move three to ten times more air through your lungs than at rest. Whatever is in that air gets the same multiplier. Home gyms and yoga rooms deserve their own ventilation plan.
Once the air clears outside, the ash that settled on every horizontal surface during the smoke event becomes the next problem. The cleanup protocol matters because dry sweeping puts everything you tried to keep out back into the air.
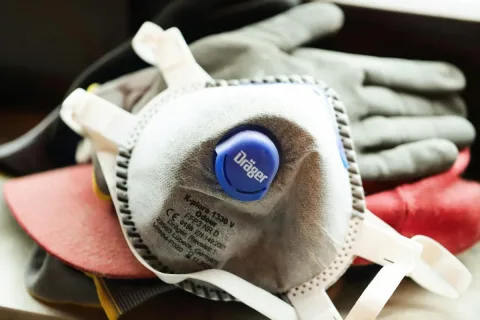
A particle-filtering respirator is the one piece of protection a HEPA at home cannot give you. Here is what each rating means and when each one is the right tool.
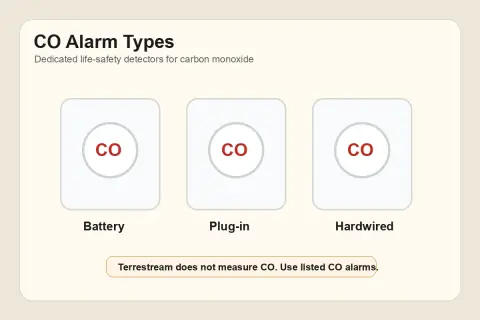
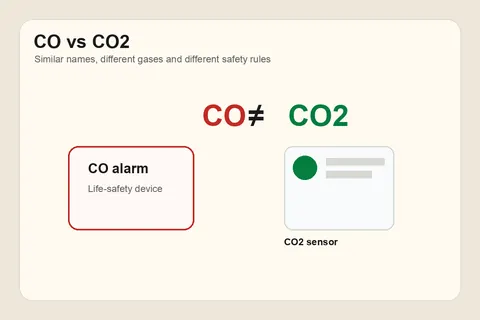
Terrestream measures CO₂ only - it does not measure CO. Use UL-listed CO alarms.
Carbon monoxide and carbon dioxide sound alike and the abbreviations look alike. They are completely different gases. Terrestream measures CO₂ only.
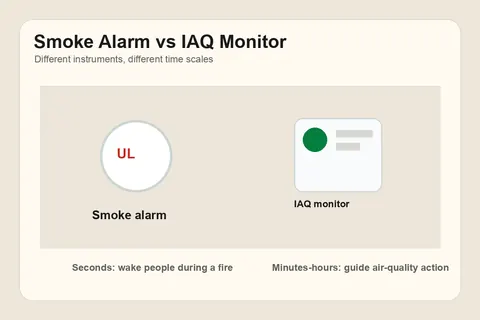
The particle sensor sees smoke once it fills a room. A UL 217 smoke alarm sees it in seconds and screams loud enough to wake a sleeping family. They are not substitutes.
Radon is the second-leading cause of lung cancer in the US after smoking. It cannot be detected by any optical, NDIR, or MOX sensor; only alpha-particle counters can see it.
Terrestream measures a specific set of air-quality parameters. There are many hazards it does not measure at all - here is a non-exhaustive list of common ones, and the dedicated detector or test to use instead.
Homes built before 1978 (US) and before 1992 (Canada) are likely to contain lead paint. Renovating without containment releases lead-laden dust that no air-quality sensor can identify.
Asbestos was used in insulation, popcorn ceilings, vinyl flooring, and roofing through the 1980s. Disturbing it releases microscopic fibers we cannot detect; mesothelioma latency is decades.
Terrestream is not a smoke alarm. Every home needs UL 217 smoke alarms.
A common confusion: the sensor on your wall reads PM2.5, and smoke is PM2.5, so it must be a smoke alarm too. It is not. The two devices answer different questions on different timescales with different consequences for being wrong.
Breathe Better. Live Smarter.
One device. Six sensors. Twelve signals. Indoor readings connected to outdoor context and plain-English recommendations. Everything you just read can be measured live in your own home.
$249 USD one-time
Buy Terrestream Explore the sensorSix sensors. Twelve signals.
Built on genuine Sensirion, Bosch, and Texas Instruments sensors.
Included
Works with
Search the knowledge base.