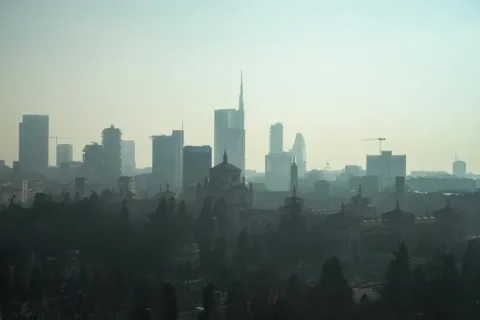

Three decades of US EPA monitoring data show that ambient PM2.5 and NO2 are not distributed evenly across populations. Census-tract-level analyses by Harvard C-CHANGE and the NIEHS environmental justice program find that Black, Hispanic, and Indigenous communities in the US experience PM2.5 exposures that average 10 to 30 percent higher than white communities even after controlling for income, and NO2 exposures that can run 50 percent higher because NO2 tracks traffic and the highest-traffic corridors disproportionately bisect non-white neighborhoods. Income explains some of the gap but not most of it; race remains a significant predictor after income adjustment.
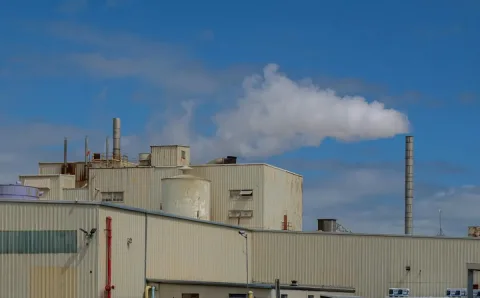
The drivers are historical and structural, not behavioral. Redlining in the 1930s and 1940s shaped which neighborhoods got federal mortgage backing and which did not, and the unbacked neighborhoods then absorbed the freeway routes, the rail yards, the bus depots, the power plants, the refineries, and the warehouse districts that nobody wealthy would accept nearby. School and housing siting followed the same gradient: schools serving Black and Hispanic children in California are three times more likely to sit within 500 feet of a major roadway than schools serving white children, per multiple EPA environmental-justice analyses. Port and industrial truck traffic concentrates diesel exhaust in the communities adjacent to the ports of Los Angeles, Long Beach, Newark, and Houston. None of this was distributed by accident; it was distributed by policy.
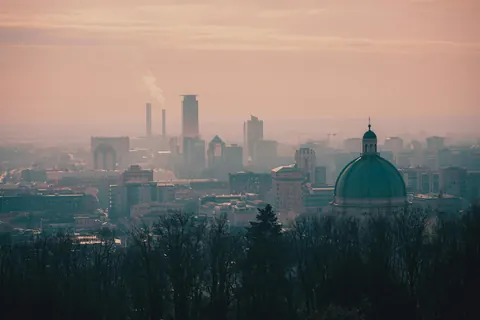
The health consequences are measurable. Asthma hospitalization rates for children in the South Bronx run roughly eight times the rate in the Upper East Side, twenty subway stops north. Life expectancy in the worst-polluted census tracts in cities like Cleveland, Detroit, and St. Louis runs 10 to 20 years below the best-polluted tracts in the same city. The Harvard Six Cities cohort and its successors have followed the chronic-PM2.5 dose-response curve down to single-digit µg/m³, and the verdict is unambiguous: even small differences in long-term exposure produce measurable differences in cardiovascular mortality. The disparities in the air translate directly into disparities in years of life.
An indoor sensor cannot solve any of that. What it does do is make the indoor consequence of a high-outdoor environment visible: a household in a high-PM zip code that runs a properly sized HEPA, keeps windows closed during outdoor PM events, and ventilates strategically can hold indoor PM2.5 well below outdoor regardless of the outdoor number. That is a meaningful health intervention at the household level. It is not a substitute for policy. The avenues for policy work include EPA EJScreen for understanding your tract's cumulative load, community air-monitoring networks (PurpleAir + AirNow + local efforts), state cumulative-impact assessment laws (California SB 1000, New Jersey EJ law), and the long fight to relocate or shut down concentrated industrial sources. The dashboard answers "what is happening in my air right now"; the policy work answers "why does my air look like this in the first place."
This is general guidance, not a substitute for professional assessment of your specific home. Major interventions (HVAC redesign, sealing a leaky envelope, mold remediation, electrical work for fans or venting) should be done with a certified professional. For chronic problems that do not respond to the steps here, see when to call a pro.
References
- EPA - Environmental and Climate Justice Program www.epa.gov
- Harvard C-CHANGE - Environmental justice hsph.harvard.edu
- NIH NIEHS - Translational environmental health www.niehs.nih.gov
- WHO - Social determinants of health www.who.int