AQI vs IAQ: the same scale, two contexts
Both numbers use the same 0–500 color band, but the math is different and so is the answer to "is it bad?"

Guides & support
Set up your sensor, connect your home, and make sense of your air.
Tagged: Outdoor contextBrowse all guides
1–12 of 27 guides
Both numbers use the same 0–500 color band, but the math is different and so is the answer to "is it bad?"
When outdoor ozone or pollen is high, "open a window" stops being good advice.
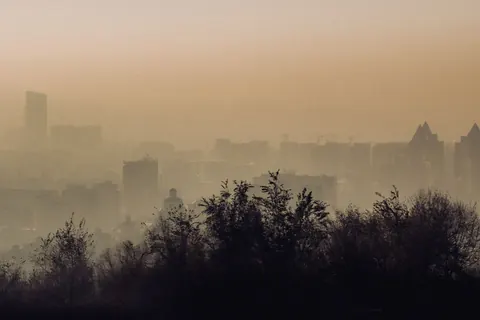
A complex aerosol dominated by PM₂.₅, with VOCs, NOx, and dozens of trace species. Indoors, the right response is to seal up and filter, not ventilate.
SO₂ comes from burning sulfur-bearing fuels: coal, heavy oil, diesel ships, volcanic activity, and wildfires. The device does not measure it; the dashboard pulls it from Open-Meteo.
Three reasons your number rarely matches the official outdoor AQI: hyperlocal variation, time resolution, and calibration class.
The UV index condenses solar ultraviolet intensity into a 0–11+ scale. Above 6, take precautions. Above 8, every minute counts.
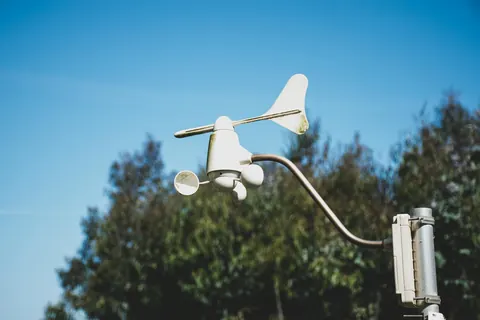
Outdoor wind drives air through small cracks and gaps in your building. Higher wind = more outdoor air entering, whether you want it or not.
Alder, birch, grass, mugwort, olive, ragweed: European pollen forecasts track each separately, and the seasons are very different. Terrestream's pollen levels come from Google.
Rain and snow wash particles out of the air, but not all sizes equally: pollen, dust and the tiniest particles go quickly, while most fine-particle mass lingers.
The single most consequential daily decision the dashboard helps you make. Six outdoor signals, three indoor signals, one answer.
The same reading means different things in cold-dry, hot-humid, and temperate climates. Knowing your zone tells you which problems to watch for.
Winter, spring, summer, fall. The dominant indoor-air pressure changes with the calendar.
Canada uses a 0–10+ health-risk index instead of the US 0–500 AQI. Different math, different recommendations, same goal.
What satellites see when they look at our atmosphere. Aerosol Optical Depth quantifies how much sunlight gets scattered or absorbed by particles, and it lines up with ground-level PM in useful ways.
Saharan dust to the Caribbean and Texas, Asian dust to the Pacific Northwest. Distinct from wildfire smoke chemically, sometimes visually similar.
How far you can see is a rough but useful gauge of how much fine particulate is in the air, as long as the air is dry.
Cloudy days produce less outdoor ozone. Sunny days produce more. Ozone forecasts build that in, and Terrestream reads the ozone forecast for your home's location.
Direct radiation, diffuse radiation, shortwave total. The numbers behind outdoor ozone, indoor lux, and the circadian signal all come from the same place.
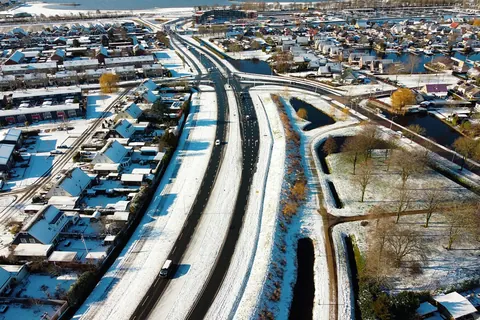
Fresh snow scrubs particulates from outdoor air. Persistent snow traps cold air at the surface, sometimes for days, with all that implies for inversions.
A short list of headline genera covers the broad strokes, but tree pollens vary by region. Oak in the South, cedar in Texas, maple in the Northeast, birch in the North.
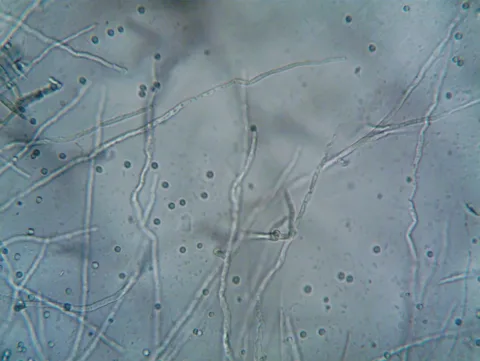
Outdoor mold spore counts are tracked alongside pollen by allergy services. Different biology, often confused, sometimes the actual culprit when pollen seems low.
NH₃ from livestock and fertilizer is a major PM2.5 precursor. The outdoor feed does not carry ammonia itself; what the dashboard shows is the resulting outdoor PM2.5, from the Google Air Quality API or, when Google's reading is more than three hours old, from Open-Meteo.
Ground-level ozone is the most consequential summertime air pollutant in much of North America. The sensor cannot detect it directly; the dashboard pulls it from Open-Meteo.
The dashboard's outdoor card layers several data streams: Open-Meteo for weather and modeled air quality, Google Air Quality for current pollutants and the US EPA AQI while its reading is under three hours old (Open-Meteo's values otherwise), and Google Pollen for pollen forecasts. Here is the pipeline.
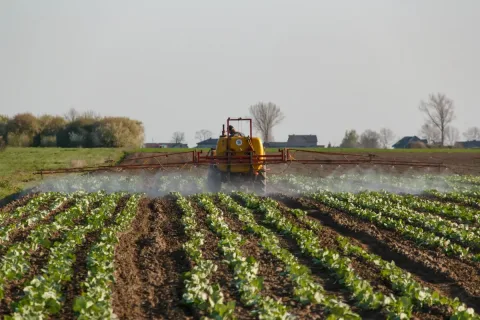
Pesticide drift is the rural-IAQ analog of wildfire smoke: outdoor-driven, episode-based, and worst during spraying seasons. The playbook is forecast, close, filter.
Outdoor PM2.5 and NOx sit higher near highways, near ports, near industrial sites, and downwind of all three; those locations correlate with race and income in the United States and Canada in ways that are not accidents.
A fixed indoor sensor cannot follow you into a car cabin, a bus, or a bike lane next to a highway. The exposure that happens on the way to work is real, and it belongs to a different category of instrument.
Search the knowledge base.