
A single sensor measures a single point. Two or more sensors measure relationships between spaces, which is where most of the interesting interpretations live. When the bedroom CO2 climbs overnight while the living-room CO2 falls, the closed bedroom door is the explanation. When PM2.5 rises in the living room 20 minutes after a kitchen spike, you are seeing kitchen-to-living-room air transport, which tells you something about your floor plan and HVAC return locations.
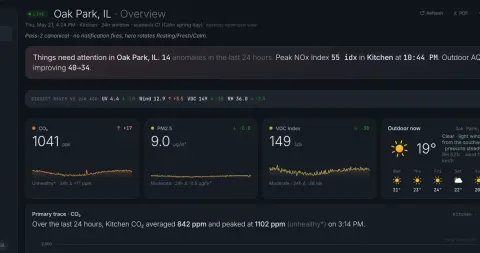
A typical multi-room layout: one sensor in the main living space (kitchen-adjacent if open-plan), one in the primary bedroom, optionally one in a child's bedroom, home office, or basement. The dashboard's multi-room view aligns the time-axes and shows per-room sparklines; the AI cross-correlates them to identify which room is the source for which event.
Cross-room correlation is the diagnostic. When all rooms rise together with the same shape, the source is outdoor (infiltration through windows or building envelope) or HVAC-distributed (a duct-borne issue). When one room leads by 10-30 minutes and others follow with attenuation, internal transport is the path. When one room is consistently different from the rest, there is a localized source (a closed bedroom, a candle, a piece of off-gassing furniture).
Practical placement: rooms with the highest occupancy density (master bedroom, family room) get priority. Rooms with frequent source events (kitchen, garage-adjacent, bathroom) are next. Storage rooms, hallways, and unoccupied basements are low-priority. Two sensors are noticeably more useful than one; three covers most of the diagnostic value for a typical home; beyond four the marginal value drops sharply unless the home is very large or has very different microclimates per zone.
References
- LBNL Indoor Air Quality science portal iaqscience.lbl.gov
- Klepeis et al. - National Human Activity Pattern Survey doi.org
- EPA - Improving indoor air quality www.epa.gov
- ASHRAE Standard 62.2 - Residential ventilation www.ashrae.org