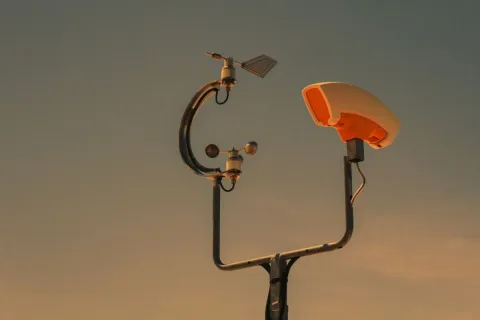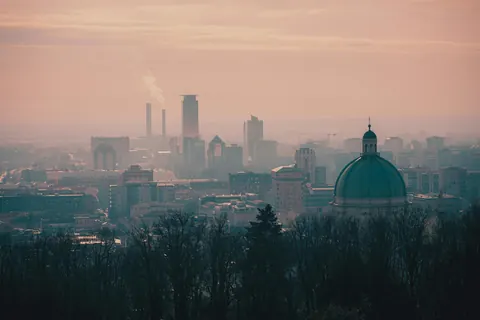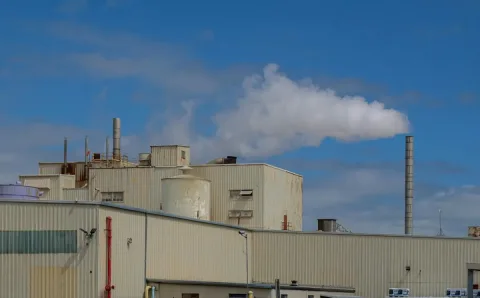

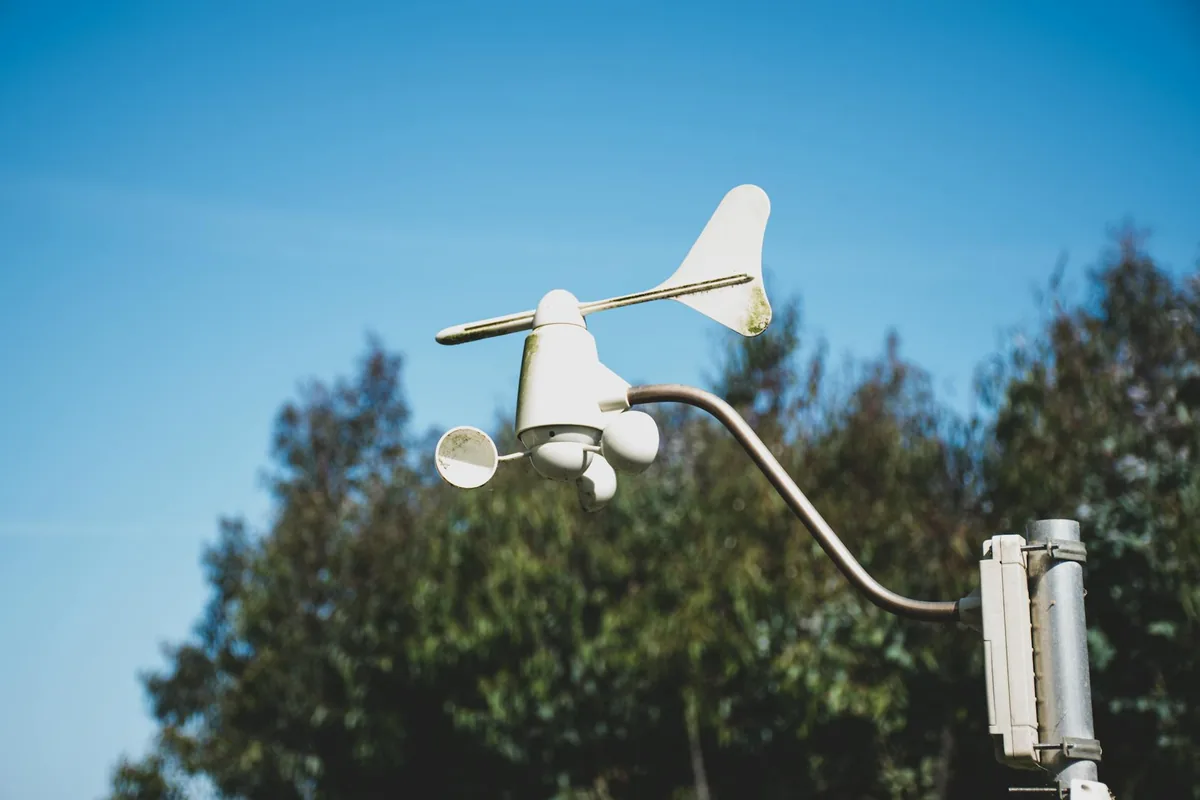
The Terrestream sensor measures what is in the room. It does not measure what is outside. For outdoor conditions the dashboard depends on third-party data feeds: temperature, humidity, pressure, wind, precipitation, and UV index; ozone, NO2, SO2, carbon monoxide, PM10, PM2.5, dust, and aerosol optical depth; the US AQI; tree, grass, and weed pollen levels; and weather alerts, satellite smoke plumes, and fire detections. The combined picture (indoor sensor + outdoor feed) is what lets Terrestream recommend when to open windows, run a HEPA filter, or close the house up.
There are three providers. The weather side is Open-Meteo, an open-data weather API that aggregates multiple upstream models: ECMWF (the European reference forecast), NOAA GFS, regional models like ICON-D2 and HRRR, and station observations from METAR and national networks. The air-quality side is the Google Air Quality API, which supplies current PM2.5, PM10, and ozone, a universal AQI, and the local US EPA AQI, drawn from government monitoring networks and atmospheric models. Terrestream shows Google's PM2.5 and US AQI while they are less than three hours old, and Open-Meteo's modeled values otherwise. Open-Meteo's air-quality forecast adds nitrogen dioxide, sulfur dioxide, carbon monoxide, dust, and aerosol optical depth, along with the hourly pollutant forecasts. The pollen side is the Google Pollen API, which forecasts tree, grass, and weed pollen by region.
Update cadence and accuracy. Current weather and the modeled air-quality data refresh about hourly, Google's air-quality readings several times a day, and pollen forecasts once a day. Forecasts run several days out with declining accuracy past day 3; for "open a window?" decisions the app looks about 8 hours ahead. Spatial accuracy is best near urban monitoring stations and degrades in rural areas where the model leans more on simulation and less on observations. Ozone forecasts are generally good in summer because the inputs are well-characterized; SO2 is rougher because point-source events (volcanic eruptions, refinery upsets) are not well-predicted by regional models. See where do the numbers come from for the indoor side of the same question.
References
- Open-Meteo - Air Quality API documentation open-meteo.com
- Open-Meteo - Forecast API documentation open-meteo.com
- Copernicus CAMS - Global atmosphere monitoring atmosphere.copernicus.eu
- AAAAI - Pollen allergy guide www.aaaai.org
- AirNow - AQI Basics (ozone) www.airnow.gov