What Terrestream can and cannot tell you
The dashboard interprets your air. It does not diagnose you, replace your doctor, or detect things the sensor cannot measure.

Guides & support
Set up your sensor, connect your home, and make sense of your air.
Tagged: InterpretationBrowse all guides
13–24 of 28 guides
The dashboard interprets your air. It does not diagnose you, replace your doctor, or detect things the sensor cannot measure.
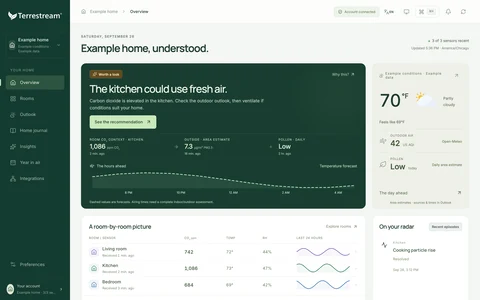
Product preview · Example data
How to read the dashboard and the apps: what band, baseline, spike, trend, anomaly, fingerprint, confidence and cross-reference mean.
After a source stops, each pollutant decays with its own characteristic shape. The math behind "the room should clear in about 20 minutes," and why real rooms don't always follow it.
Minutes to seasons. Knowing which time scale a parameter lives on is half of interpreting it correctly.
Air-quality parameters do not change in isolation. Humidity pushes the VOC index. Ozone reacts with limonene to make formaldehyde. Knowing the interactions helps you avoid false alarms.
A bad afternoon and a bad decade are different problems. Dose, peaks, and several mild elevations at once: what the literature says matters for what.
Is your air normal? Population-level studies and the dashboard's own data let you compare to typical homes.
Three words public-health professionals use carefully. Loose usage in air-quality conversations causes most of the misinterpretation.
When a reading is far outside what is usual for that room, Terrestream flags it and suggests what to check instead of guessing a cause. That is by design.
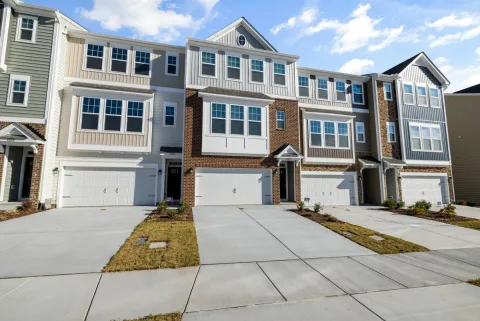
Apartments, townhomes, detached single-family, and commercial buildings each have characteristic air-quality patterns. Knowing yours helps you read the numbers.
Every reading on the dashboard has a source: a sensor on the device, a computation from sensor inputs, or an outdoor API. Knowing which is which is the first step in interpreting any of them.
PM10, PM2.5, PM1.0, ultrafines. Same physics, different particle-size buckets. The size determines where particles lodge in the body and what produced them.
EPA AQI, WHO 2021 guidelines, Canadian AQHI, European CAQI. Four different ways to summarize the same air.
HEPA, MERV, Corsi-Rosenthal. Three filtration paths to the same goal. Cost, performance, deployability differ in different directions.
Open windows, range hood, HRV/ERV, demand-controlled ventilation. Different ways to bring fresh air in and stale air out.
Anything that burns indoors produces a multi-pollutant signature: NOx, fine particulates, VOCs, ultrafines, and (sometimes) CO. The dashboard has a shared interpretation framework for all of them.
Mold, dust mites, pet dander, pollen, mold spores. Most household allergen exposure is one of these five. The dashboard groups them as a family.
Sometimes a room feels wrong even when every number looks normal. Comfort depends on several readings at once, above all temperature and humidity together.
Most households run on a 5-and-2 schedule. The air does too, and Terrestream learns each room's weekly CO₂ routine.
A near-linear CO₂ climb that does not decay is the signature of a room rebreathing its own air. The math is straightforward and the pattern is unmistakable on the dashboard.
Two landmark chamber studies (Satish 2012, Allen 2016) show executive function dropping monotonically as CO₂ rises from 550 to 1,400 ppm. The shape, the domains, and the mechanism candidates.
For most outdoor-driven pollutants, indoor concentration divided by outdoor concentration is the single most diagnostic number you can work out from your readings. It tells you whether your house is sealed, filtered, or leaking.
Outdoor forecasts let Terrestream suggest action before a problem arrives, not after: hours ahead for air quality, and a few days ahead for the weather outlook. Here is how the forecast horizon maps to confidence.
Each of the three inputs is a signal. Combined, they help anticipate whether an indoor event is about to happen, so you can act before it does.
Terrestream's recommendations come from fixed rules applied to your readings and outdoor data. Here is what the confidence label on a situation means, and what it does not.
The dashboard will tell you about your air. It will not diagnose, prescribe, or speculate about your health. The line between those two is bright and intentional.
CO₂ does not measure pathogens. But CO₂ and exhaled pathogen droplets share a source (occupants) and a sink (ventilation), so the indoor-to-outdoor CO₂ ratio tracks the fraction of air in the room that other people have already breathed. This is why the Aranet model was widely adopted for ventilation monitoring during the pandemic.
Warm air rises, cool air falls, and exhaust fans push the balance around. The result is that pollutants move through a building in predictable directions, the basement supplies the bedrooms more than you think, and a bath fan can backdraft a water heater. The dashboard makes the patterns visible.
Search the knowledge base.